.png&w=3840&q=75)
Table of Content
- Introduction to Epidemiological research
- The flow of epidemiological research
- **1. Formulate a Research Question**
- **2. Study Design**
- **3. Collection of Data**
- **4. Data-analysis and Scientific Interpretation**
- Types of Research in Epidemiology: DEPTH model
- **Diagnostics in Practice**
- **Differential Diagnoses**
- **Diagnostic Decision Making**
- **Refining Risk and Making Decisions**
- **Scientific Diagnostic Research**
- Practical example
- Data analysis in 3 steps:
- Case: 200 patients with neck stiffness at ER
- **2x2 Table Composition**
- **Calculations from the 2x2 Table**
- **Which Measure Would Be Most Useful in Clinical Practice?**
- **Multivariable Analysis in Diagnostic Research**
- **ROC Curve Analysis**
- **Cut-off Values**
- **Clinical Implications**
- Etiologic Research in practice
- **Key Points in Etiologic Research:**
- **Examples of Etiologic Research:**
- **Study Designs in Etiologic Research:**
- **Selection of Cases and Controls:**
- **Bias in Etiologic Research:**
- **Confounding Bias**
- **Selection Bias**
- **Information Bias**
- Prognostic Research in practice
- **Case Example:**
- **Importance of Prognostic Research:**
- **How Prognosis is Determined in Clinical Practice:**
- **Data Analysis in Prognostic Research:**
- **Reporting Prognostic Research:**
- **Similarities Between Diagnostic and Prognostic Research:**
- **Differences Between Diagnostic and Prognostic Research:**
- Intervention Research in practice
- Definition and Characteristics:
- Example Scenario:
- Methodology:
- Considerations in Intervention Research:
- Challenges and Alternatives:
- **Measuring Disease Frequency:**
- **Measuring Associations:**
- **Applying These Measures:**
- **Summary of Research Types and Measures:**
- **Dealing with Association Measures:**
Introduction to Epidemiological research
- Definition: Epidemiology is the study of how often diseases occur in different groups of people and why, focusing on the distribution(who, when, and where) and determinants (causes and risk factors) of health and disease conditions in defined populations.
- Determinants are for example, physical, biological, and social factors that influence health
- Purpose: It aims to understand the complex causes of diseases to improve public health and prevent disease through research, community education, and health policy.
The flow of epidemiological research
1. Formulate a Research Question
This initial step involves clearly defining what you want to study. A well-formulated research question is specific, measurable, and focused on a particular health outcome, population, and potential determinants or interventions. For example, "What is the effect of aspirin on cardiovascular disease events in healthy elderly individuals?" This question specifies the outcome (cardiovascular disease events), the determinant (aspirin), and the population of interest (healthy elderly individuals).
2. Study Design
After defining the research question, the next step is to choose an appropriate study design that can best answer the question. The choice of study design is crucial and depends on the nature of the question, the available resources, and ethical considerations. Common epidemiological study designs include:
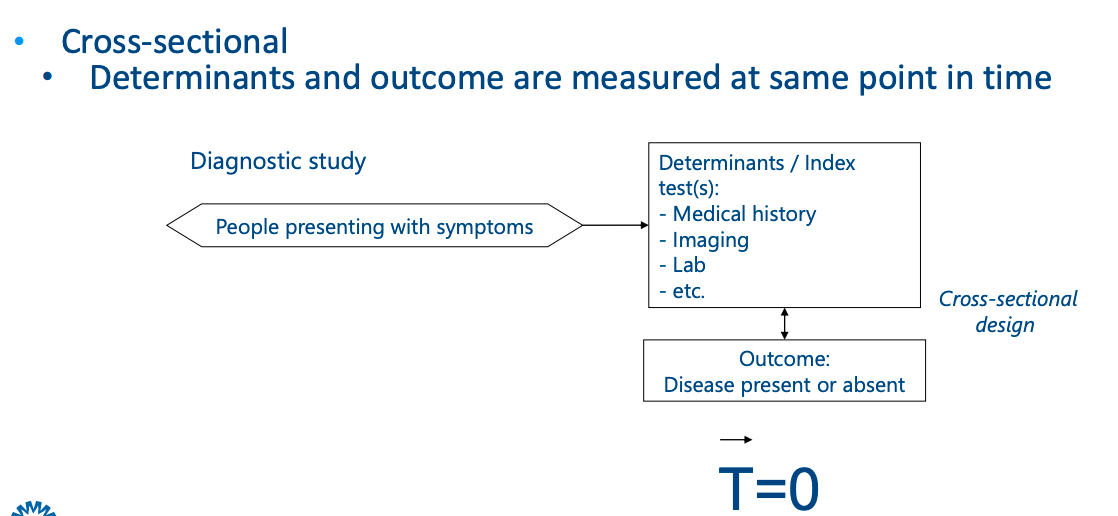
- Cross-sectional studies: Capture a snapshot of a population at a single point in time, identifying prevalence and correlations.
- Cohort studies: Follow a group of individuals over time to assess how exposures affect outcomes
- Case-control studies: Compare individuals with a disease (cases) to those without it (controls) to identify exposures or risk factors
- Randomized Controlled Trials(RCTs) are used to test the efficacy of interventions in a controlled setting. Participants are randomly assigned to intervention or control groups.
3. Collection of Data
This involves gathering data necessary to answer the research question. Data collection methods vary depending on the study design and can include surveys, medical records reviews, laboratory tests, and more. This step requires careful planning to ensure the data are accurate, reliable, and applicable to the study population. It's also essential to consider ethical issues related to privacy and consent during data collection.
4. Data-analysis and Scientific Interpretation
Once the data are collected, the next step is to analyze them to find answers to the research question. This usually involves statistical analysis to test hypotheses or explore associations between variables. The analysis should be planned in advance to use appropriate statistical methods that match the study design and data type.
After analyzing the data, researchers interpret the findings in the context of existing knowledge, considering the study's limitations and potential biases. The interpretation should address the original research question and assess the implications for public health or clinical practice. This step often culminates in publishing the findings in scientific journals, where they undergo peer review to ensure the research is rigorous and contributes valuable knowledge to the field.
Types of Research in Epidemiology: DEPTH model
- Diagnostic Research: This always starts with a patient with complaints or symptoms and focuses on finding effective methods for determining the presence of a disease.
- Etiologic Research aims to uncover the causes or factors that lead to the onset of diseases (e.g., the link between smoking and lung cancer).
- Prognostic Research: Studies the forecast of the disease course, helping to predict outcomes and the effect of the treatment.
- Intervention Research: Tests interventions to prevent disease or improve its management.
Diagnostics in Practice
- Initial Presentation: It begins with a patient presenting with symptoms, such as a child coming to the Emergency Room (ER) with a very stiff neck. This symptom triggers the diagnostic process.
- Aim of the Physician: The primary goals are to quickly and efficiently estimate the correct diagnosis, which will inform the choice of therapy and prognosis.
Differential Diagnoses
- Considering Possibilities: Based on the initial symptom, the physician considers a range of possible diagnoses, including serious conditions like bacterial meningitis (BM), which can be fatal if missed, alongside other possibilities like viral meningitis, pneumonia, ENT infections, or myalgia.
Diagnostic Decision Making
- Prevalence and Prior Risk: Using knowledge such as the prevalence of BM among children presenting with neck stiffness in the ER, the physician estimates a prior risk. For example, if 20% of similar cases are BM, this figure sets a baseline risk against which further diagnostic steps are measured.
- Diagnostic Testing: To reduce uncertainty, further diagnostics are considered. The best test in this scenario might be a lumbar puncture (culture of cerebrospinal fluid), known as the "gold standard" or “reference test” for diagnosing BM. However, performing such an invasive test on every child with neck stiffness may not be ethical or practical.
- Use of Diagnostic Tools: Before resorting to the gold standard, less invasive tests (e.g., medical history, physical examination, simple lab tests, imaging) are used to refine the risk assessment. This stepwise, escalating approach helps balance the need for accurate diagnosis against the risks and costs of testing.
Refining Risk and Making Decisions
-
Posterior Risk: Based on the results of initial, less invasive tests, the physician recalculates the risk (now termed "posterior risk") of the child having BM. The bigger the difference prior - posterior risk, the more the diagnostic value of tests. This ongoing risk assessment informs whether further testing is needed or if a diagnosis can be made.
-
Action Thresholds: The decision to proceed to more invasive tests, treat empirically, or discharge a patient depends on balancing the risk of the disease against the potential harm and costs of further investigation or treatment.

Scientific Diagnostic Research
- Research Objectives: The aim here is to identify which tests genuinely contribute to accurately estimating the risk of disease presence in symptomatic patients. This often involves comparing the diagnostic value of various tests and determining how they can best be combined to improve diagnostic accuracy.
- Study Design and Analysis: Diagnostic research typically involves observational study designs, where the performance of different diagnostic tools is evaluated against the gold standard in a real-world clinical setting. This includes assessing the sensitivity, specificity, predictive values, and likelihood ratios of the tests in question.
Practical example
Data analysis in 3 steps:
- Estimate prior risk (without test results)
- Compare each index test result with reference test results • Univariable
- Compare combinations of index test results with reference test result • Multivariable • Order of index test results in clinical practice • Determine added value of index test results as compared to already collected, previously collected index test results
Case: 200 patients with neck stiffness at ER
- Liquor culture positive (BM+) n=40
- Liquor culture negative (BM-) n=160 Step 1: A priori risk (prevalence) for BM? 40/200=20%
Step 2: Analysis per determinant (univariable)
Sex (m/f); neck stiffness (y/n); fever > 38°C (y/n) 2 by 2 table --> e.g. fever > 38°C

2x2 Table Composition
- A (True Positives, TP): The number of individuals who have both the condition (BM) and the test indicator (fever).
- B (False Positives, FP): The number of individuals who do not have the condition but do have the test indicator.
- C (False Negatives, FN): The number of individuals who have the condition but do not have the test indicator.
- D (True Negatives, TN): The number of individuals who neither have the condition nor the test indicator.
Calculations from the 2x2 Table
- Sensitivity (SE): The probability that the test is positive given the person has the disease. Calculated as SE=TP+FNTP=20/40=50. This measures how good the test is at detecting the disease.
- Specificity (SP): The probability that the test is negative given the person does not have the disease. Calculated as SP=FP+TNTN=70/160=43.75. This measures how good the test is at identifying those without the disease.
- Positive Predictive Value (PPV+): The probability that the person has the disease given that the test is positive. Calculated as PPV=TP+FPTP=20/110=18.18. This measures the likelihood that someone with a positive test actually has the disease.
- Negative Predictive Value (NPV-): The probability that the person does not have the disease given that the test is negative. Calculated as NPV=FN+TNTN=70/90=77.78. This measures the likelihood that someone with a negative test truly does not have the disease.
Which Measure Would Be Most Useful in Clinical Practice?
The usefulness of each measure depends on the context of the test and the condition being tested for:
- Sensitivity is crucial in tests used for screening to ensure that as many cases as possible are identified early.
- Specificity is important when a positive test result might lead to significant interventions or treatments, thus you want to minimize false positives.
- PPV becomes more relevant in populations with a higher prevalence of the disease since it reflects the likelihood that a positive test indicates disease.
- NPV is particularly valuable in ruling out a disease when a test is negative, especially in settings where the disease is rare, and early exclusion is important.
In the scenario of diagnosing BM where missing a diagnosis could have severe consequences, high sensitivity might be considered the most important to ensure that nearly all cases are detected, albeit at the cost of more false positives, which can then be further investigated with more specific tests.
Multivariable Analysis in Diagnostic Research
- Combining Tests: In clinical practice, the diagnosis of a condition like Bacterial Meningitis (BM) often relies on more than one diagnostic test or piece of information.
- Creating a Model: A statistical model may incorporate various factors (medical history, physical exam results, patient demographics like sex and age, symptoms such as fever and pain, etc.) to predict the risk of BM. Each factor (determinant) contributes to the model, which is treated as a single diagnostic test.
- Interpretation: The model is then interpreted in terms of its diagnostic value to predict the presence of BM.
ROC Curve Analysis
- ROC Curve: It is a graphical plot used to show the diagnostic ability of a binary classifier system as its discrimination threshold is varied. It's created by plotting the true positive rate (sensitivity) against the false positive rate (1-specificity) at various threshold settings.
- AUC (Area Under the ROC Curve): This is a measure of the test's ability to correctly classify those with and without the disease. An AUC of 0.50 suggests no diagnostic ability (equivalent to a random guess), while an AUC of 1.0 represents perfect diagnostic ability.
- Comparing Models: Different models can be compared using their AUC values. For instance, Model 1 with medical history and physical exam might have an AUC of 0.72, suggesting it has some ability to distinguish between patients with and without BM. Model 2, which includes medical history and blood tests, might have an AUC of 0.90, indicating a higher diagnostic value.
Cut-off Values
- Determining Cut-offs: The cut-off values for tests are critical. They determine the sensitivity and specificity of the test, influencing the ROC curve. The best cut-off is one that maximizes sensitivity and specificity, which often is a balance depending on the clinical context.
Clinical Implications
- Practical Application: The purpose of these analyses is to improve medical practice by providing evidence-based data on the usefulness of diagnostic tests and procedures.
- Reporting Standards: Findings should be reported in a way that is practical and understandable for clinicians. The STAndards for Reporting of Diagnostic accuracy (STARD-2015) provides guidelines to ensure clear and transparent reporting of diagnostic research.
In summary, multivariable analysis and ROC curve analysis are tools used in diagnostic research to evaluate and report on the accuracy and usefulness of diagnostic tests. The goal is to inform and enhance clinical decision-making, thereby improving patient outcomes.
Etiologic Research in practice
Etiologic research is a branch of epidemiology that seeks to find the cause or origin of health outcomes or diseases (etiologies). It investigates the relationship between a risk factor or exposure (the determinant) and the occurence of a health-related event or disease (the outcome).
Key Points in Etiologic Research:
- Assessment of Causality: The core objective is to establish whether a cause-and-effect relationship exists between the determinant and the outcome. It requires that exposure to the determinant occurs before the onset of disease.
- Explanatory vs. Descriptive Research: Etiologic research is explanatory, aiming to explain why and how a disease occurs, as opposed to descriptive research, which focuses on describing the occurrence of disease without necessarily determining a cause.
- Determinant-Outcome Relationship: The relationship must not be explainable by other factors, known as confounders, which could skew the apparent relationship between the determinant and outcome.
Examples of Etiologic Research:
- Smoking and Lung Cancer: Researchers might investigate whether smoking is associated with an increased risk of lung cancer by looking at the incidence of lung cancer in smokers versus non-smokers. They would use statistical methods to control for other factors (confounders) that might influence the risk.
- Creutzfeldt-Jakob Disease (CJD): In the case of CJD, a rare and fatal brain disease, researchers could investigate whether a new variant of the disease is caused by consuming beef, especially in the context of the mad cow disease outbreak in the 1990s.
Study Designs in Etiologic Research:
-
Cohort Studies: These are longitudinal studies where a group of individuals (a cohort) is followed over time to see who develops the disease. Participants are classified based on their exposure status (e.g., smokers and non-smokers), and the incidence of disease is compared between the exposed and non-exposed groups.

-
Risk Ratio (Relative Risk): The risk of disease in the exposed group is compared to the risk in the non-exposed group. For instance, if smokers have a 20% incidence of lung cancer and non-smokers have a 6.25% incidence, the risk ratio would be 3.2, suggesting that smokers have a 3.2 times higher risk of developing lung cancer compared to non-smokers.

-
-
Case-Control Studies: These are typically used when the outcome is rare or has a long latency period. Researchers start with a group of cases (people who have developed the disease) and compare their exposure history to a group of controls (who do not have the disease).

-
Odds Ratio: It compares the odds of exposure among cases to the odds of exposure among controls. If people with CJD are 3.75 times more likely to have consumed beef compared to controls, the odds ratio is 3.75, suggesting a strong association between beef consumption and CJD.

-
Selection of Cases and Controls:
- Cases are selected based on the presence of disease, often from hospitals or clinics.
- Controls should be selected from the same population that the cases came from and should represent what the cases would have been like had they not developed the disease.
- Determinants can be measured through medical records, interviews, or questionnaires.
Bias in Etiologic Research:
Confounding Bias
- Definition: Confounding occurs when the relationship between the exposure and the outcome is mixed with the effect of another variable that is associated with both the exposure and the outcome.
- Example: If you're studying the relationship between birth order and Down Syndrome but fail to account for maternal age (which is related to both birth order and the risk of Down Syndrome), maternal age is a confounder.
- Dealing with Confounding:
- In Analysis: Use statistical techniques such as stratification, multivariable analysis, or propensity score matching to adjust for the confounding factors.
- In Study Design: Design the study to minimize confounding, for example, by matching cases and controls on potential confounders in a case-control study or by randomization in a randomized controlled trial (RCT).
Selection Bias
- Definition: Selection bias occurs when the process of selecting participants or their continued participation in a study affects the observed association.
- Examples:
- If a study only includes hospitalized patients who may have more severe disease or different characteristics than the general population, this can lead to biased results.
- In a case-control study for DVT, if cases are more likely to recall and report use of birth control because they are searching for a reason for their condition, this could result in selection bias.
- Dealing with Selection Bias: Ensuring that both cases and controls are representative of the population from which they were drawn and that their selection is not influenced by exposure or outcome status.
Information Bias
- Definition: Information bias occurs when there are systematic differences in the way data on exposures or outcomes are obtained from the study groups.
- Examples:
- Differential accuracy of self-reporting between cases and controls can lead to misclassification bias.
- Diagnoses that are more easily confirmed in individuals with a known exposure can lead to differential misclassification of the outcome.
- Dealing with Information Bias: Blinding the outcome assessors to the exposure status, using objective data sources for determining exposure and outcome (like medical records instead of self-report), and using the same methods to collect information from all study participants.
By recognizing and controlling for these biases, researchers can better determine the true relationship between determinants and outcomes, contributing valuable information to our understanding of disease processes and informing public health interventions.
Prognostic Research in practice
Prognostic research in the field of medicine is concerned with the future course and outcome of diseases in patients who have already been diagnosed. This research aims to identify and evaluate factors that can predict the future health outcomes of patients. Below are key aspects of prognostic research explained in the context provided:
Case Example:
An example of a prognostic study could be investigating whether high levels of C-Reactive Protein (CRP) are an independent predictor of mortality within 30 days following a heart attack.
Importance of Prognostic Research:
- Informing Treatment: It helps clinicians and patients understand the likely course of a disease or condition, which can be vital in selecting appropriate treatment options.
- Risk Prediction: It can identify patients who are at high risk of negative outcomes, such as death or disease recurrence, so that interventions can be targeted more effectively.
How Prognosis is Determined in Clinical Practice:
- Using Predictors: Factors such as patient characteristics, lab results, and other test outcomes are analyzed to predict future health outcomes.
- Designing the Study: Like diagnostic research, the study design usually involves identifying the study population and the setting in which the prognostic scores will be used.
- Cohort Studies: Often used in prognostic research where patients are followed over time to see which outcomes occur.
Data Analysis in Prognostic Research:
- Univariable Analysis: Initially, each potential predictor is analyzed separately to determine its relationship with the outcome.
- Multivariable Analysis: Multiple predictors are then analyzed together to assess their combined effect on the outcome. This often includes the use of a Receiver Operating Characteristic (ROC) curve to evaluate the performance of the prognostic model.
- Risk Models: Developed to estimate the absolute risk of an outcome, such as death or recurrence of disease, for individual patients based on a combination of predictors.
Reporting Prognostic Research:
- Relevant Endpoints: It's important to report findings that are directly relevant to patients, such as the absolute risk of specific outcomes rather than just relative risks or average survival rates.
- Transparency: Just as with diagnostic research, it's crucial to report findings transparently and in a way that can be applied in clinical settings.
Similarities Between Diagnostic and Prognostic Research:
- Both types of research are observational and often descriptive, aimed at identifying risk factors for certain outcomes.
- Both require the analysis of determinants (predictors) that are directly related to the outcomes of interest.
Differences Between Diagnostic and Prognostic Research:
- Timing: Diagnostic research assesses determinants and outcomes at the same point in time (cross-sectional), whereas prognostic research involves following patients over time (longitudinal).
- Objective: Diagnostic research is focused on identifying the presence or absence of a disease at a specific point, while prognostic research is concerned with the likelihood of future events or outcomes based on determinants measured at baseline.
Prognostic research is a critical component of evidence-based medicine as it provides valuable information for healthcare providers and patients on the expected course of a disease, facilitating informed medical decision-making and personalized care.
Intervention Research in practice
Intervention research is a type of study designed to assess the effects of a specific intervention on an outcome. These interventions could be medical treatments, lifestyle modifications, educational programs, or policies. The goal is to establish a causal relationship—whether the intervention directly causes changes in the outcome.
Definition and Characteristics:
- Experimental: It often involves experiments where the intervention is controlled by the researcher.
- Causal: The primary aim is to determine whether the intervention causes an outcome.
- Controlled Environment: Ideally, the research is conducted in a setting that allows the researcher to control for external factors that might influence the outcome.
Example Scenario:
Ms. X, a 65-year-old woman, has been diagnosed with high blood pressure. The physician prescribes a beta-blocker and monitors her blood pressure over the following weeks. The intervention research question here would be: Does treatment with a beta-blocker reduce blood pressure in patients with hypertension?
Methodology:
- Randomized Controlled Trials (RCTs): Participants are randomly assigned to either the intervention group or the control group (which may receive a placebo or no intervention). This randomization helps ensure that the two groups are comparable in all respects other than the intervention.
- Data Analysis: Changes in the outcome are measured and compared between the intervention and control groups. The analysis could include various statistical methods, and results might be presented as mean differences, relative risks (RR), or risk differences.
- Reporting: Results should be reported with confidence intervals to convey the precision of the estimate and p-values to indicate statistical significance.
Considerations in Intervention Research:
- Blinding: To avoid information bias, neither the participants nor the researchers should know who has been assigned to which group (double-blind study).
- Intention-to-treat vs. Per Protocol: Analyses are often conducted on an intention-to-treat basis, where participants are analyzed in the groups to which they were originally assigned, regardless of whether they completed the intervention as planned. A per-protocol analysis includes only those who completed the treatment as intended.
- Validity and Precision: Validity is concerned with the study's ability to accurately measure the intervention's effect without systematic errors or bias. Precision is about minimizing random errors, which is influenced by the standardization of measurements and the sample size.
- Generalizability: While RCTs are considered the gold standard for determining causality, the stringent conditions of a trial might limit how results can be applied to broader, more diverse populations.
Challenges and Alternatives:
- Costs and Ethical Dilemmas: Intervention studies can be expensive and time-consuming and may face ethical issues, especially if using a placebo would withhold effective treatment.
- Observational Studies: As alternatives, observational studies can be used, though they are more susceptible to biases, such as confounding by indication (patients with worse prognosis are more likely to receive certain medications).
Measuring Disease Frequency:
- Prevalence: Refers to the proportion of a population found to have a condition at a specific time. For example, in intervention research, one might measure the prevalence of high blood pressure among a group of patients before and after the introduction of an exercise program to determine the program's effectiveness.
- Incidence: This measures the number of new cases of a disease that develop in a population during a specified time period. It helps determine the risk of developing the disease. In intervention research, one might track the incidence of lung cancer in a population of smokers who have been given a smoking cessation intervention compared to those who have not received the intervention.
- Cumulative Incidence: This is the proportion of a population that develops the disease over a specified time period. For example, researchers may calculate the cumulative incidence of diabetes over 10 years among individuals who are following a particular diet versus those who are not.
- Incidence Density: This is similar to incidence but accounts for the person-time at risk. For example, if conducting an intervention study on a new cancer drug, researchers may report the incidence density of adverse effects, considering the total time each participant was exposed to the drug.
Measuring Associations:
- Relative Risk (Risk Ratio): This compares the risk of a health-related event occurring in the intervention group with the risk in the control group. For instance, if 2% of patients on a new cholesterol drug experience a heart attack compared to 4% on a placebo, the relative risk of a heart attack with the drug is 0.5, suggesting a protective effect.
- Odds Ratio: In studies where the outcome is rare, researchers might calculate the odds ratio, which is the odds of an event occurring in the intervention group compared to the odds in the control group. It is commonly used in case-control studies.
- Risk Difference: This is the difference in risk between the intervention and control groups. It provides information on the absolute change in risk due to the intervention.
Applying These Measures:
When evaluating the effectiveness of an intervention, researchers will use these measures to determine if there is a statistically significant difference in disease occurrence between the intervention group and the control group. For example, they might report that a new hypertension drug reduces the incidence of stroke by a certain percentage compared to a placebo, or they may demonstrate through relative risk that a vaccine lowers the chances of contracting a disease by a certain factor.
Summary of Research Types and Measures:
- Diagnostic Research:
- Involves measures such as prevalence (the proportion of individuals in a population having a disease at a given time) and diagnostic accuracy metrics including sensitivity (ability of a test to identify true positives), specificity (ability of a test to identify true negatives), positive predictive value (PPV), negative predictive value (NPV), odds ratio (OR) for the likelihood of disease given a positive test, relative risk (RR) comparing risk in exposed vs. unexposed groups, and the area under the ROC curve (AUC) which evaluates the performance of a diagnostic test.
- Prognostic Research:
- Typically utilizes incidence rates (new cases of disease over time in a population) to determine the risk and probability of future outcomes such as death or disease recurrence after diagnosis. It also uses OR, RR, and AUC for predictive accuracy.
- Etiologic Research:
- Focuses on identifying causes of disease and also uses incidence rates to determine risk, as well as OR and RR to quantify the strength of the association between exposures and outcomes.
- Intervention Research:
- Studies the effect of interventions on outcomes, often using incidence, RR, and mean difference between groups to assess the intervention's impact.
Dealing with Association Measures:
- Validity: Refers to the degree to which a study accurately reflects the reality it aims to represent. It necessitates the absence of systematic errors and bias.
- Precision: Reflects the consistency and reliability of the association measure and depends on the standardization of the measurement process and the size of the study population.
In conclusion, the choice of study design in epidemiological and clinical research is crucial and depends on the research question, the characteristics of the disease being studied, the feasibility of conducting the study, and the resources available. Each design—cross-sectional, cohort, case-control, and randomized controlled trials—offers unique advantages and comes with specific limitations.
Cross-sectional studies are invaluable for assessing the disease burden within a population at a single point in time. They are relatively quick, inexpensive, and straightforward, making them ideal for public health assessments and preliminary data gathering. However, their inability to establish causality limits their use in understanding the dynamics between exposures and outcomes.
Cohort studies, both prospective and retrospective, allow for the examination of the incidence and risk factors over time, providing a clear picture of how exposures affect outcomes. They are particularly useful in studying rare exposures and can handle multiple outcomes for a single exposure. Nevertheless, they require large sample sizes and are time-consuming and costly, with potential for loss to follow-up which can introduce bias.
Case-control studies are particularly suited for investigating rare diseases or outcomes with long latency periods. They are generally quicker and less expensive than cohort studies and can efficiently handle multiple exposures. However, they are susceptible to information and selection biases and typically do not provide data on the absolute risk or rates of disease.
Randomized controlled trials (RCTs) are the gold standard for testing the efficacy and safety of interventions due to their ability to minimize bias through randomization and control. RCTs can provide robust evidence on causality, which is essential for clinical decision-making and policy development. However, the stringent design of RCTs, ethical considerations, cost, and sometimes limited generalizability of their results pose significant challenges.