.png&w=3840&q=75)
Table of Content
- Methodological individualism
- Network perspective
- Node-level metrics
- Network-level metrics
- **1. Network Size and Diameter**
- **2. Degree Distribution**
- **3. Density**
- **4. Clustering**
- **5. Centralization**
- Community structure
- Echo Chambers
- Community Detection
- **Optimization Problem**
- **Algorithm Steps (Simplified):**
Methodological individualism
Methodological individualism is a philosophical approach that emphasises the importance of individual agents in explaining social phenomena and the function of social systems. Society can be nothing else than just that: all the individuals that compose society.
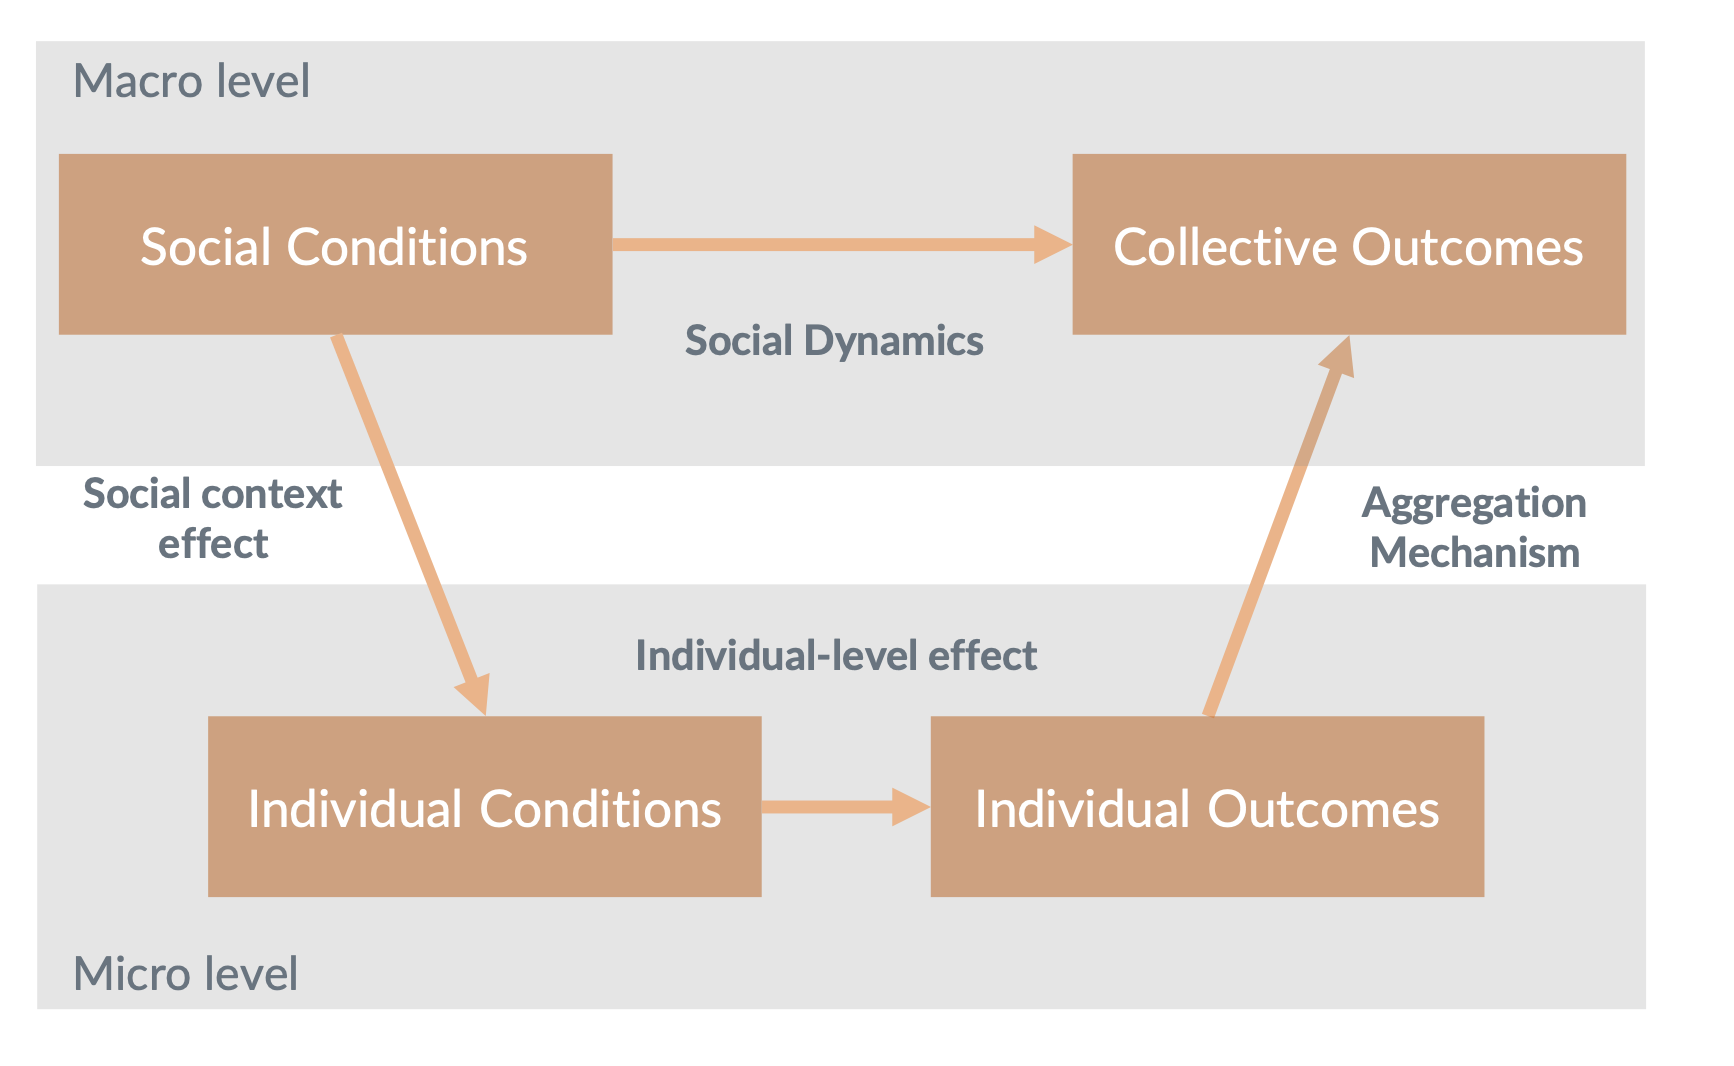
- Macro level: The higher level, broader social context of the environment. This includes for example social structures.
- Social conditions: The specific conditions at the macro level that affect how individuals and groups interact and behave. These might include economic conditions.
- Social dynamics: The processes and interactions between different social conditions that lead to certain outcomes at the macro level.
- Micro level: The lower-level, focussing on individuals. This is were individual behavior and interaction are considered.
- Individual conditions: These are the personal circumstances or attributes of individuals, such as personal beliefs, economic status, education etc, that influence their actions and decisions.
- Individual Outcomes: The results of individual actions based on their conditions. This can include personal achievements, changes in behavior, or decisions made.
- Collective outcomes: These are the large-scale patterns, trends, or results that arise from the aggregation of individual actions and interactions and the social dynamics. These outcomes are at the macro level of analysis, which means they pertain to be broader society or social systems rather than to individuals.
Network perspective
Social network analysis helps in understanding the structure of social relationships, how information flows within the network, and how influential or central certain actors are within the network.
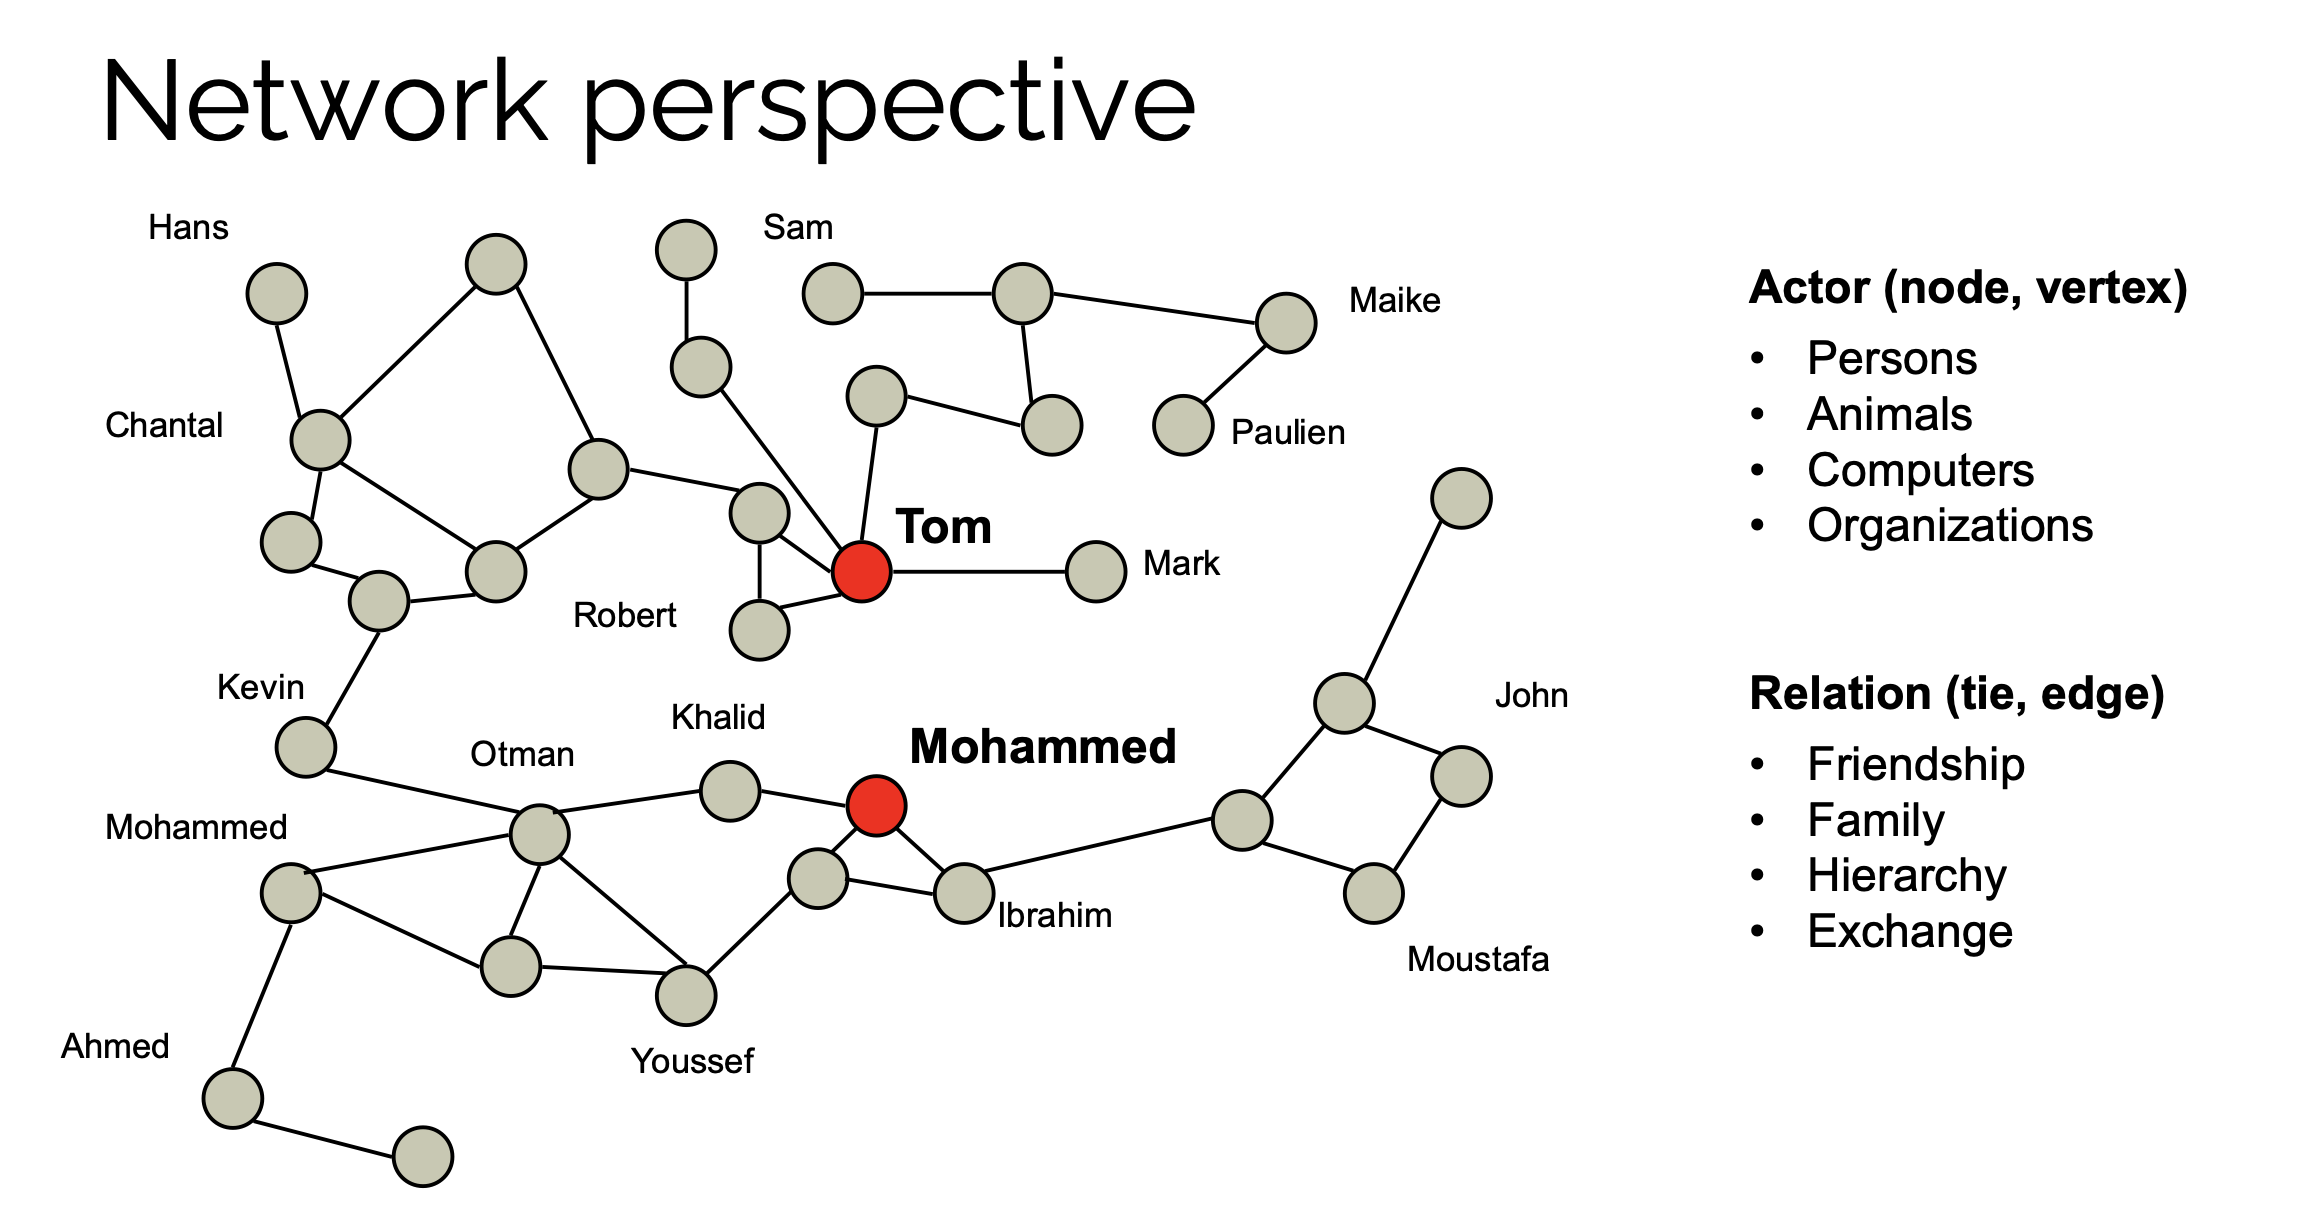
- Nodes: The beige and red circles represent different actors within the network. The size and color of a node might indicate the importance or the role of the actor within the network. For example, the red nodes could signify that Tom and Mohammed are central or key actors within this network, possibly those with many connections or with strategic importance.
- Edges: The lines connecting the nodes indicate the presence of a relationship. The thickness or style of a line might denote the strength or type of relationship, although this particular graph does not specify these details.
- Clusters: The arrangement of nodes might show clusters or groups within the network, which could indicate sub-communities or clusters where the actors are more closely related to each other.
Node-level metrics
In social network analysis, node-level metrics are used to understand the roles and characteristics of individual nodes within the network. Here are explanations for each metric listed:
-
Degree (Number of Links):
- The degree of a node is the number of connections it has. In an undirected network, this is simply the count of how many edges are attached to the node.
-
Indegree:
- The indegree is a metric used in directed networks and represents the number of inward links a node has. In other words, it’s the number of times other nodes point to this node. It often indicates popularity or the status of being a receiver in a network (e.g., how many people send messages to this person).
-
Outdegree:
- Outdegree, also specific to directed networks, refers to the number of outward-directed links from a node. It signifies how many times a node points to others and can be a measure of gregariousness or influence (e.g., how many people someone sends messages to).
-
Degree Centrality:
- This is a measure of how connected or central a node is in the network, calculated by taking the degree of the node and normalizing it by the maximum possible degree in the network. High degree centrality indicates a highly connected or pivotal participant within the network.
-
Closeness Centrality: the closest one to all other nodes
-
Closeness centrality reflects how close a node is to all other nodes in the network. It is typically calculated by inverting the sum of the shortest distances from the node to all other nodes. Nodes with a high closeness centrality can quickly interact with all others directly or through others efficiently.

-
-
Betweenness Centrality: how often a node is a bridge between other nodes
-
This metric measures the extent to which a node lies on the shortest path between other nodes. Nodes with high betweenness centrality are often bridges or bottlenecks in the network, controlling the flow between different parts of the network.

-
-
Eigenvector Centrality: (Google pagerank)
-
Eigenvector centrality assigns relative scores to all nodes in the network based on the concept that connections to high-scoring nodes contribute more to the score of a node than equal connections to low-scoring nodes. This metric identifies nodes with influence over the entire network, not just those with many connections.

-
-
Local Clustering Coefficient:
- The local clustering coefficient of a node measures how close its neighbors are to being a complete graph (or clique). It reflects the likelihood that the node’s friends (neighbors) are friends with each other. A higher clustering coefficient means a greater 'cliquishness' or density of connections in the node’s immediate neighborhood.
Network-level metrics
1. Network Size and Diameter
-
Network Size refers to the number of nodes within the network. It's a fundamental characteristic that gives a sense of the scale of the network.
-
Diameter is the longest shortest path between any two nodes in the network. It represents the "distance" across the network in terms of the number of steps required to traverse from one end to the other at its widest point. The diameter provides insight into the network's "spread" or how far apart nodes can be within it.

2. Degree Distribution
-
Degree Distribution describes how the connections in the network are distributed among the nodes. It's a histogram or frequency distribution that shows the proportion of nodes with each possible degree (number of connections). This metric is critical for understanding the network's topology. For example, in some networks (like social networks), you might find that a few nodes (popular individuals or major hubs) have many connections, while most nodes have relatively few. This kind of distribution, often approximated by a power-law, suggests a scale-free network where there are significant hub nodes that greatly influence the network's dynamics and resilience.

3. Density
-
Density measures the closeness of a network to its maximum possible number of edges. It's calculated as the ratio of the number of actual edges to the number of possible edges. High density means the network is closely connected, with many nodes directly linked to each other. Low density indicates a sparse network where nodes are less directly connected, and interactions or connections are more selective or limited. Network density affects how quickly information or influence can spread through the network.

4. Clustering
-
Clustering Coefficient is a measure of the degree to which nodes in a network tend to cluster together. The local clustering coefficient for a node measures how complete the subgraph of its neighbors is (i.e., what fraction of its neighbors are also neighbors of each other). The global clustering coefficient aggregates this information for the entire network, giving a sense of the prevalence of tightly knit groups within the network. High clustering in social networks suggests a tendency for forming tight-knit communities or groups, which can have implications for the spread of information, behaviors, and even diseases.
Mechanisms explaining transitivity tendency in social networks:
- Meeting oportunities
- Homophily: You like people who look like you
- Structural balans: You hope that your two best friends are also friends with each other.

5. Centralization
-
Centralization reflects the extent to which a network's structure is dominated by one or a few nodes. A highly centralized network has a star-like structure, with one or a few nodes having significantly more connections than others. Centralization is measured by comparing the actual network's structure to the most centralized possible network of the same size. High centralization suggests that the network's cohesion and flow of information are heavily dependent on the central nodes, which can be points of strength (for efficiency in communication) or vulnerability (if those nodes are removed or fail).
- A higher standard deviation indicates that there is a greater difference between the number of connections each node has. This implies that some nodes have many connections while others have few, suggesting that the network has a more central hub structure.
- A lower standard deviation suggests that the nodes are more evenly connected, and there isn't as much of a discrepancy between the number of connections per node.

Community structure
In the context of social networks, a community refers to a group of nodes (which can be people, organisations, web pages, etc) that are more densely connected to each other than to nodes outside the group. The structure of these communities can tell us a lot about the network itself, including how information flows, how influence is spread, and how cohesive or divided a network bight be.
Echo Chambers
An echno chamber is a situation where a person is only exposed to opinions that reinforce their own, limiting exposure to the diversity of thought. This phenomenon can occur in social media where algorithms personalize content, leading to a homogenization of viewpoints.
Community Detection
The goal of Community detection is to identify the groups within a network. One approach to this is modularity maximisation, which is a method that tries to find a division of the network that maximizes the density of links inside communities and minimizes the number of links between them
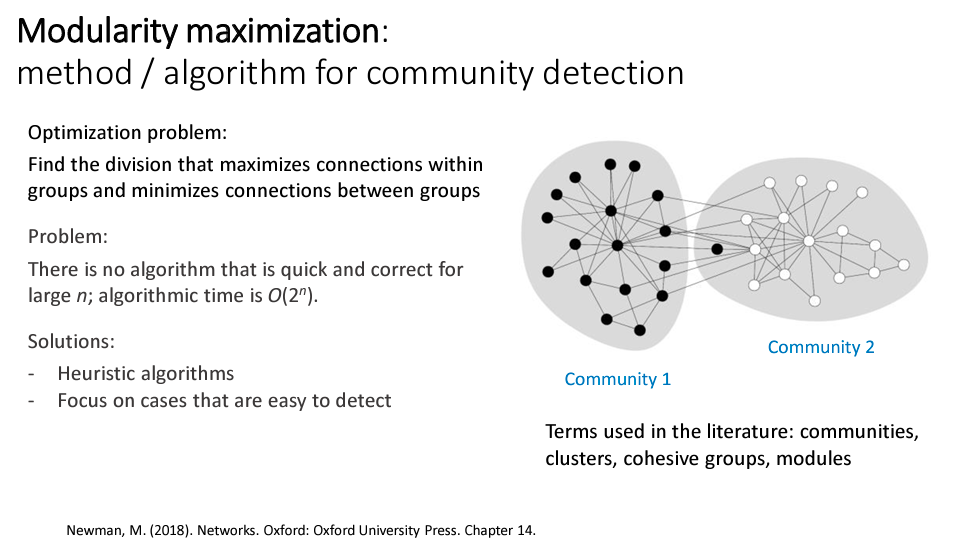
Modularity Maximization:
- Modularity(Q) is a score that measures the strength of division of a network into communities. A high modularity means that the division is good and there are dense connections between the nodes within communities and only sparse connection between nodes in different communities.
- The Algorithm for maximizing modularity often involves iterative steps where nodes are moved between communities based on whether the move would increase the modularity score.
- Due to the computational complexicty of exactly solving this problem for large networks (which is often not feasible), heuristic algorithms are used. These are approximate methods that can quickly find good (but possibly not the best) community structures.
Optimization Problem
- Optimization in this context means altering the community divisions to find the one that gives the highest modularity score.
- Heuristic Algorithms are used to make this process feasible for large networks since an exact solution is computationally intractable (time complexity is often exponential with respect to the number of nodes).
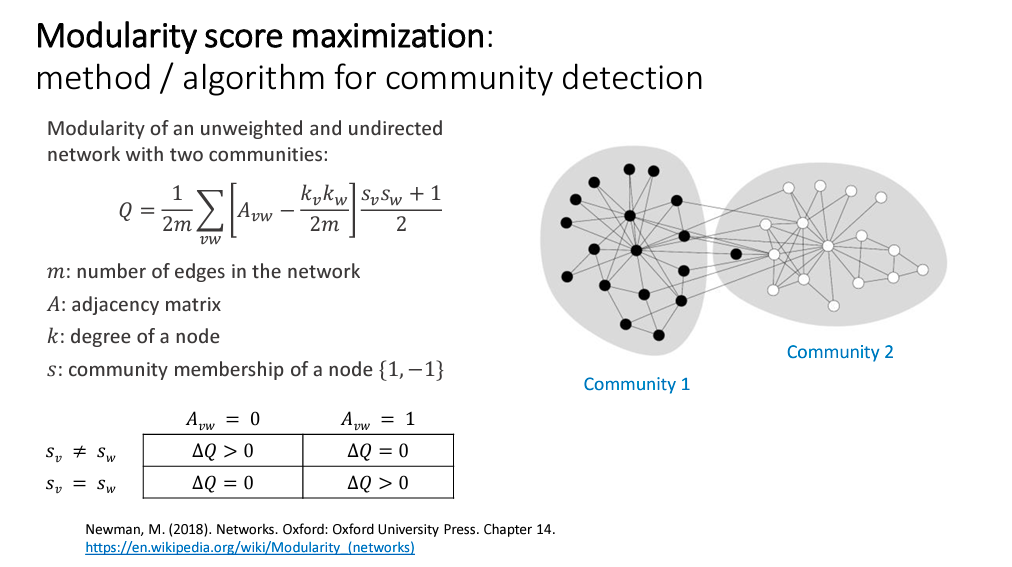
Algorithm Steps (Simplified):
- Start with a random division of the network into communities.
- For each node, calculate the change in modularity if the node were moved to a different community.
- Move the node that results in the greatest increase in modularity.
- Repeat the process until moving any node does not increase modularity.
- The result is a division of the network that the algorithm estimates to be the best community structure.